
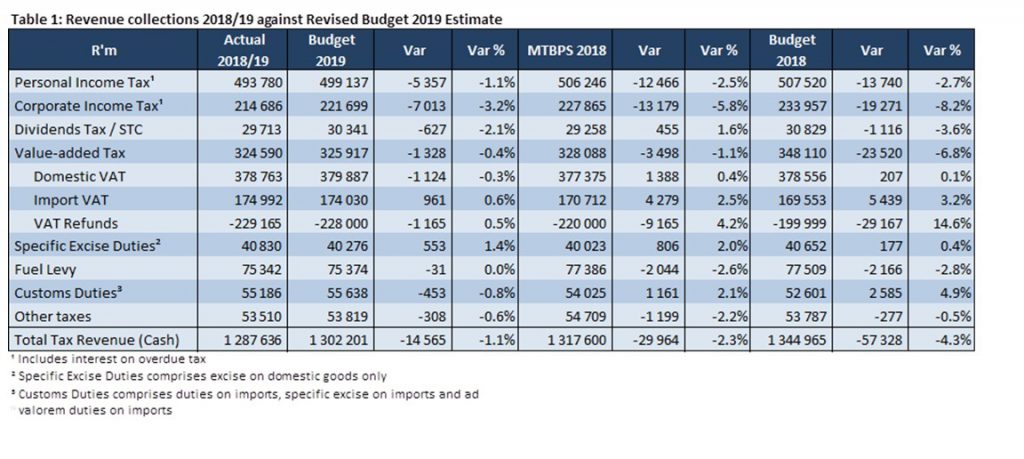
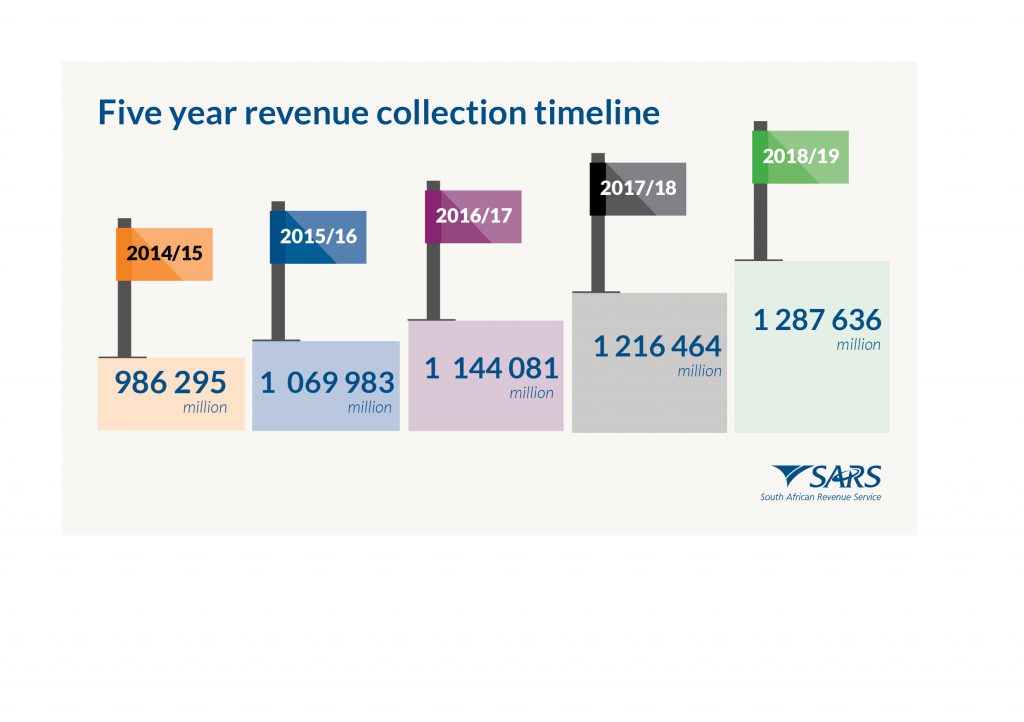
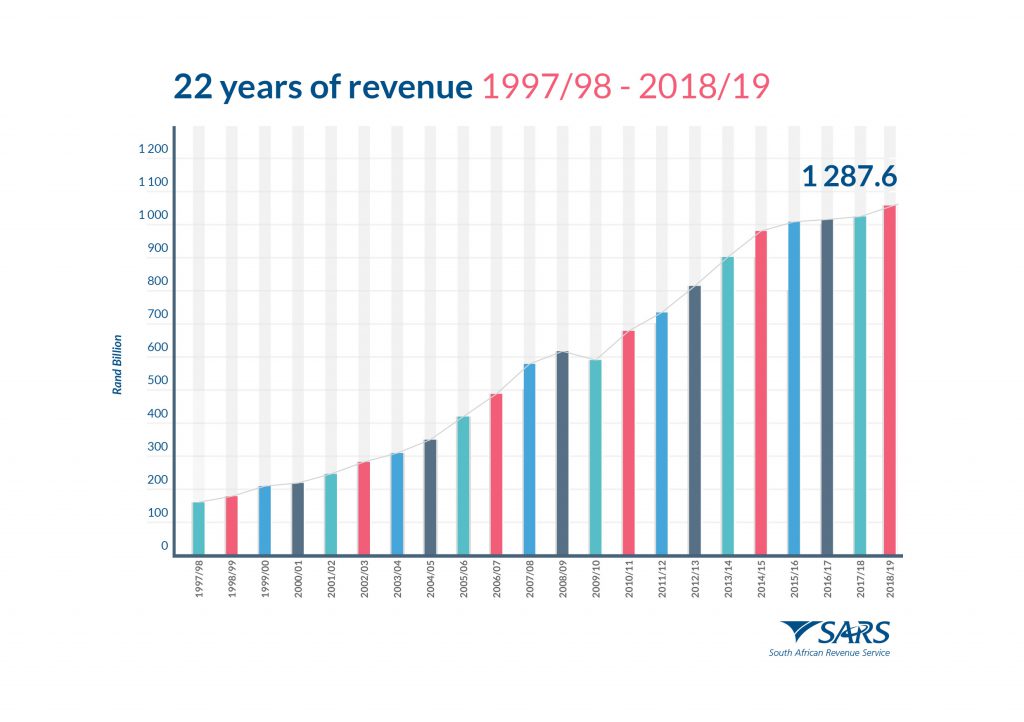
Pretoria, Monday 1 April 2019 – For the financial year ending 31 March 2019, SARS collected an amount of R1 287.6 billion, against the 2019 Budget estimate of R1 302.2 billion resulting in a deficit of R14.6 billion (-1.1%).
It should be noted that these are preliminary results, which will be subject to detailed financial reconciliation and a final audit.
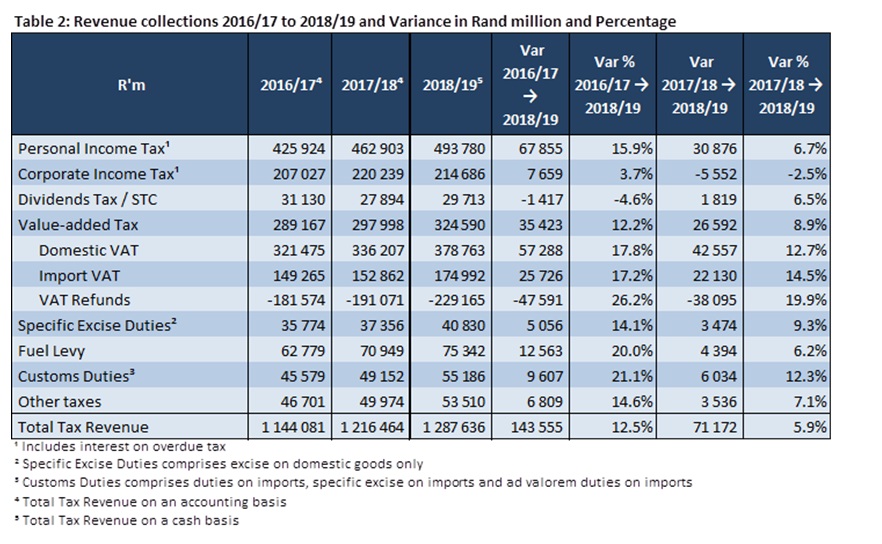
The gross amount collected is R1 575.4 billion which was offset by refunds of R287.8 billion, resulting in net collections of R1 287.6 billion. The net revenue outcome of R1 287.6 billion represents a growth of R71.2 billion (5.8%) compared to the 2017/18 financial year.
Seen against the 2019 Budget estimate of R1 345.0 billion, this results in a deficit of R 57.4 billion (-4.3%), and against the Revised Estimate of R1 302.2 billion, this results in a deficit of R14.6 billion (-1.1%).
Gross collections grew by 8.6% whilst refunds recorded strong growth of 22.7% following the announcement by the Minister of Finance during the Medium Term Budget Policy Statement (MTBPS) that the VAT refund envelope would be increased to allow the release of VAT refunds from the fiscus back into the economy.
During the reporting period, global economic growth weakened to 3.7% for 2018 and a projected growth of 3.5% in 2019. Growth has been hamstrung by US-China trade tensions (and tariff increases) in 2018, the introduction of new automobile fuel emission standards in Germany, the contraction in domestic demand in Italy due to concerns over sovereign and financial risks, as well as weak financial market sentiment and growth in Turkey.
Measured in real GDP terms, the domestic economy grew by 0.8% in 2018 from 1.4% in 2017. The major contributors to the 0.8% growth rate in 2018 were finance (0.4 of a percentage point based on growth of 1.8%) and government (0.2 of a percentage point based on growth of 1.3%). On the contrary, agriculture (-4.7% and -0.1 of a percentage point), mining (-1.7% and -0.1 of a percentage point), and construction (-1.2% and -0.0 of a percentage point) contributed negatively to GDP growth in 2018.
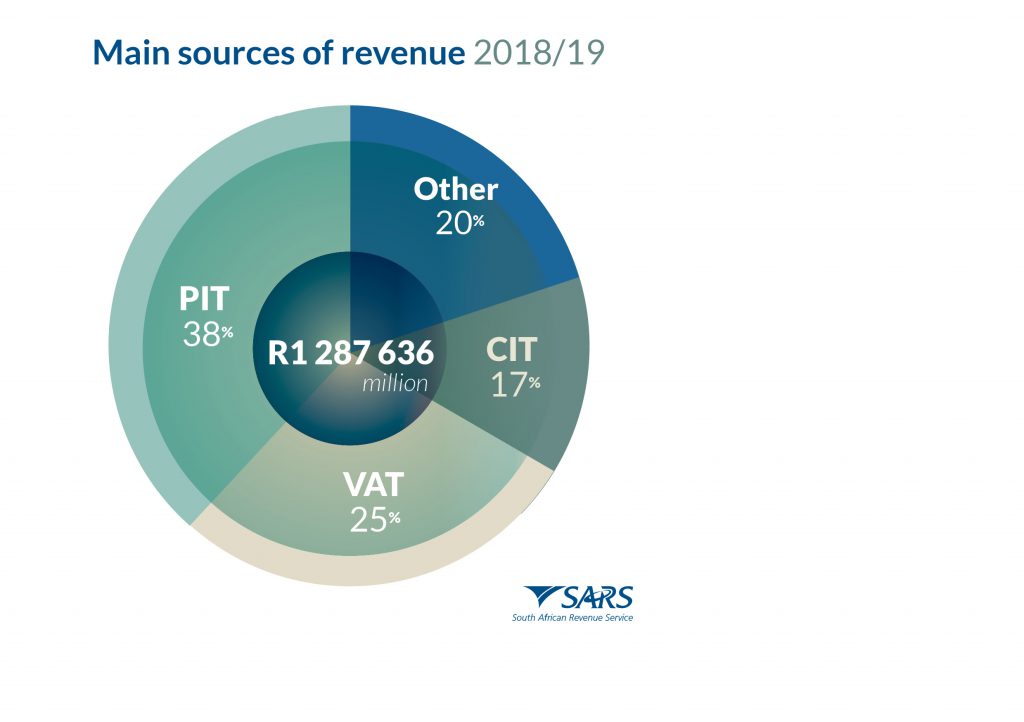
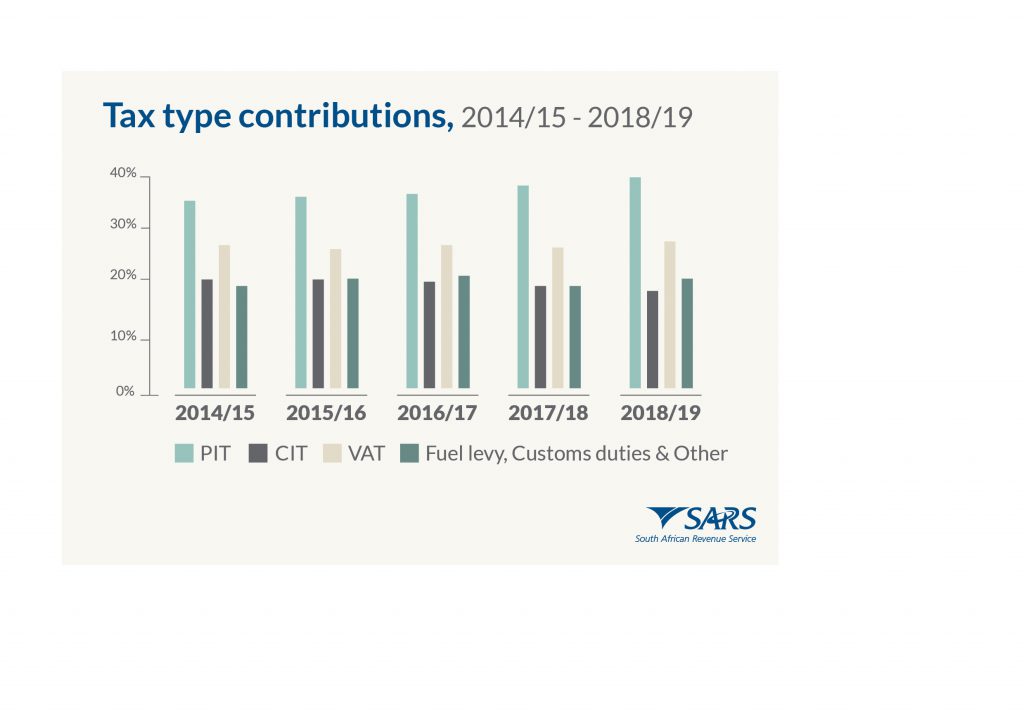
The main sources of revenue that contributed to the R1 287.6 billion collected were Personal Income Tax (PIT), which contributed R493.8 billion (38.3%), Value-Added Tax (VAT) contributing R324.6 billion (25.2%), Company Income Tax (CIT), which contributed R214.7 billion (16.7%) and Customs duties contributed R55.2 billion (4.3%).
- Pay-A-You-Earn (PAYE) collections for the year grew by 7.0% to R477.4bn, despite significant job losses, moderation in wage settlements and contraction in bonus pay-outs. However, this growth was dampened by lower share option pay-outs mainly from the finance sector, moderate public sector annual increases, job losses in the formal non-agricultural sector and lower bonus pay outs in the finance sector.
- There was double digit growth in Domestic Value-Added Tax (VAT) since May 2019 due to the benefits of the 1 percentage point increase in the VAT rate. This resulted in strong growth rates in both the large business and SMME segments of 9.8% and 14.8% respectively. For vendors who paid in both years for the relevant periods, Domestic VAT would have grown by 3.9% if there was no VAT rate increase, compared to 11.2% for that sample with the rate hike. That is why significant growth was achieved despite weak growth in retail trade sales, which continue to be under pressure. Full year collections yielded R378.8bn of which 83.0% was received via the eFiling system.
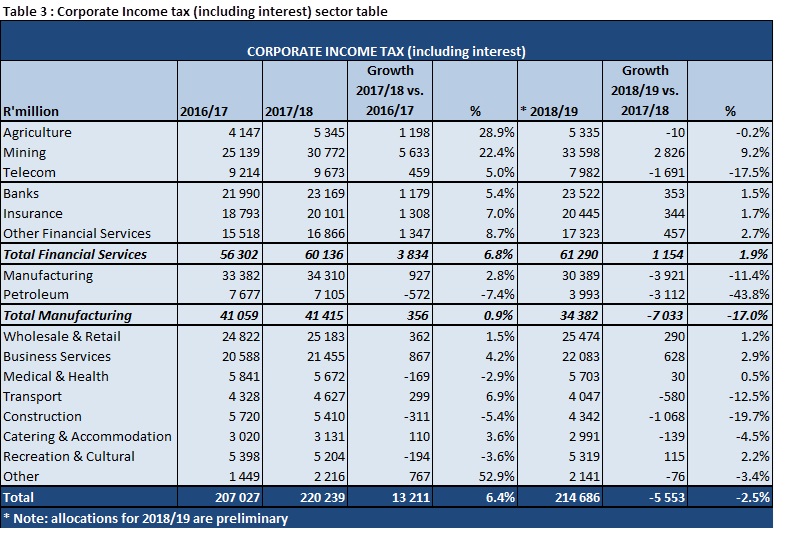
- Company Income Tax (CIT) collections contracted by 2.5%, the contraction is on the back of a significant number of CIT refunds which were paid to the large business segment and relate to multiple periods that were under audit review, as well as the continued efforts to clear the IT credit book. Furthermore, the continuing power cuts imposed by the utility company also contributed to the decline as business activities and company operations were severely affected thus affecting their profitability.
- Growth in Personal Income Tax (PIT) provisional tax payments slowed from 37.5% in August 2018 to 18.4% in February 2019, mainly due to the non-repeat and / or lower declaration of capital gains compared to the previous year.
- There was strong growth in import taxes of 14.0% for the first three fiscal quarters, after which transactional data and merchandise imports did not meet expectations during some months of the final fiscal quarter. Payments that are part of the 13th deferment statement exceeded all expectations which resulted in the overall outcome for Customs growing at 13.9% which is marginally above the required growth rate.
As announced at the Medium Term Budget Policy Statement (MTBPS) in October, the requisite fiscal space was created for SARS to reduce the credit book on VAT refunds. SARS reduced the credit book on VAT refunds from R41.8 billion in September 2018 to R25 billion by the end of the financial year, resulting in a 16.4% increase in value and 6.3% in the volume of refunds going back into the economy. Following the announcement, we see gross collections growing at 8.6% while refunds grew by 22.7%.
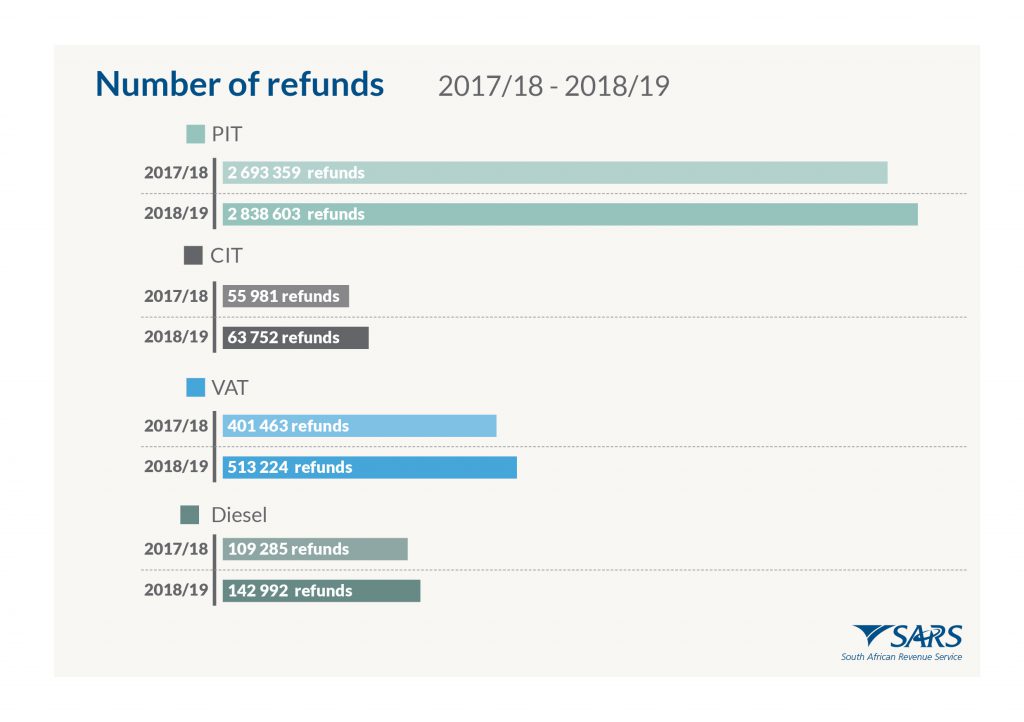
In aggregate SARS paid out R287.8 billion in refunds in the 2018/19 financial year. A total of R30.5 billion was paid in PIT refunds, reflecting a 13.8% increase on the previous year. CIT refunds totalled R22.2 billion, representing about R8.7 billion (63.7%) increase in pay-outs compared to prior year. VAT Refunds for the year totalled R229.2 billion, exceeding the estimate by R1.2 billion, reflecting an increase of R38.1 billion (19.9%) on the previous year. Growth was driven by the R15.8bn (19.9%) increase in payments to the small and medium vendors, while large vendors received R22.3bn (20.0%) more refunds than in the previous year.
There was also an increase in diesel refunds of R2.8 billion (93.3%) compared to the previous year, due to the increased reliance on diesel for electricity generation.
Although the higher refund payments lowered the net revenue collection for the year, it also puts money back into the economy.
For more information please refer to the Acting Commissioner’s Speech, the PowerPoint presentation and infographics (scroll down). These will also become available on this website under Media>Media Packs.
REVENUE TABLES:
INFOGRAPHICS:
To access this page in different languages click on the links below:
