
Note to all Media – The numbers indicated in RED EXCLUDE trade with BLNS countries, which was how monthly trade statistics were issued previously. The comparative figures in RED are included for the sake of transparency. The inclusion of BLNS country trade data was announced on 14 November 2013 and will be included in all future trade statistics.
Pretoria, 29 November 2013 – The South African Revenue Service (SARS) today releases trade statistics that includes trade data with Botswana, Lesotho, Namibia and Swaziland (BLNS) for October 2013 that recorded a trade deficit of R12.39 billion [R20.97 billion].
Summary
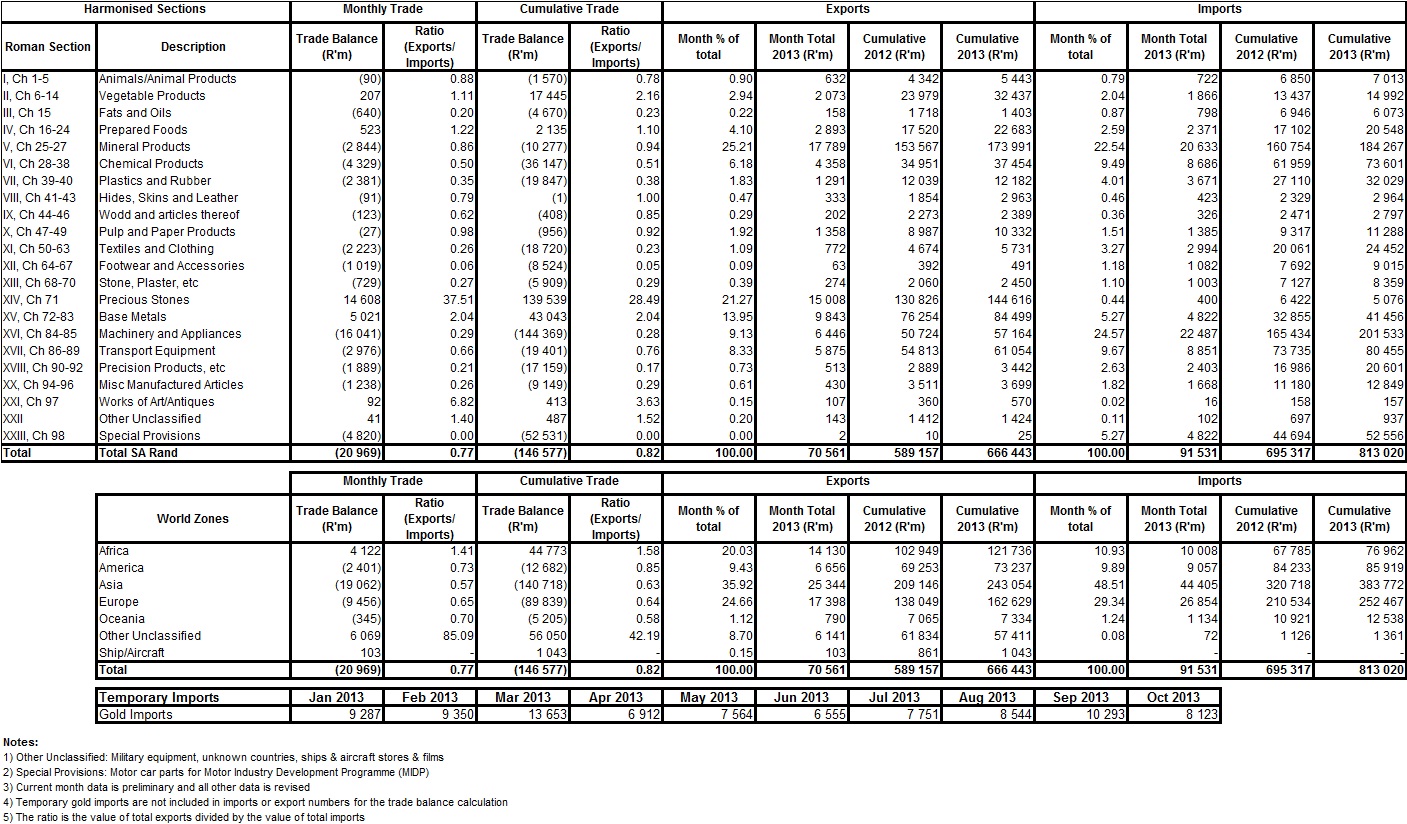
The R12.39 billion deficit for October 2013 [R20.97 billion] can be attributed to exports of R81.70 billion [R70.56 billion] and imports of R94.09 billion [R91.53 billion].
Exports increased from September to October by R5.83 billion (7.7%) [R4.02 billion (6.%)] and imports increased from September to October by R6.32 billion (7.2%) [R6.09 billion (7.1%)].
The cumulative deficit for 2013 is R76.10 billion [R146.58 billion] compared to R38.62 billion [R106.16 billion] in 2012.
Trade Highlights by Category
- The September to October change (up by 7.7%) [6%] in exports of goods reflected increases and decreases in:
- Vehicles, aircraft and vessels increased by R2 986 million (74%) [R2 793 million (91%)];
- Precious and semi-precious stones and metals increased by R 973 million (7%) [R569 million (4%)];
- Machinery and electrical appliances increased by R720 million (10%) [R452 million (8%)];
- Mineral products decreased by R 829 million (-4%) [R730 million (-4%)];
- Vegetable products decreased by R1 052 million (-28%) [R1 144 million (-36%)];
- The September to October change (up by 7.2%) [7.1%] in imports of goods reflected increases and a decrease in:
- Vehicles, aircraft and vessels increased by R1 928 million (28%) [R1 966 million (29%)];
- Products of the chemicals or allied industries increased by R1 711 million (22%) [R1 396 million (19%)];
- Machinery and electrical appliances increased by R1 249 million (6%) [R1 170 million (5%)];
- Base metals and articles thereof increased by R1 055 million (27%) [R1 038 million (27%)];
- Mineral products decreased by R1 094 million (-5%) [R1 083 million (-5%)];
Trade Highlights by World Zone
The world zone results for September to October 2013 as given below.
- Asia: The deficit increased from R16 962 million in September 2013 to R19 062 million in October 2013. Exports decreased by R1 058 million to R25 344 million and imports increased by R1 041 million to R44 405 million.
- Europe: The deficit increased from R7 591 million in September 2013 to R9 456 million in October 2013. Exports increased by R 573 million to R17 398 million and imports increased by R2 439 million to R26 854 million.
- America: The deficit decreased from R3 202 million in September 2013 to R2 401 million in October 2013. Exports increased by R1 027 million to R6 656 million and imports increased by R 225 million to R9 057 million.
- Africa: The surplus increased [decreased] from R12 082 million [R5 096 million] in September 2013 to R12 696 million [R4 122 million] in October 2013. Exports increased by R3 270 million [R1 459 million] to R25 265 million [R14 130 million] and imports increased by R2 655 million [R2 432 million] to R12 569 million [R10 008 million].
- Oceania: The deficit decreased from R 681 million in September 2013 to R 345 million in October 2013. Exports increased by R 291 million to R 790 million and imports decreased by R 46 million to R1 134 million.
For more information, visit the Trade Statistics page.
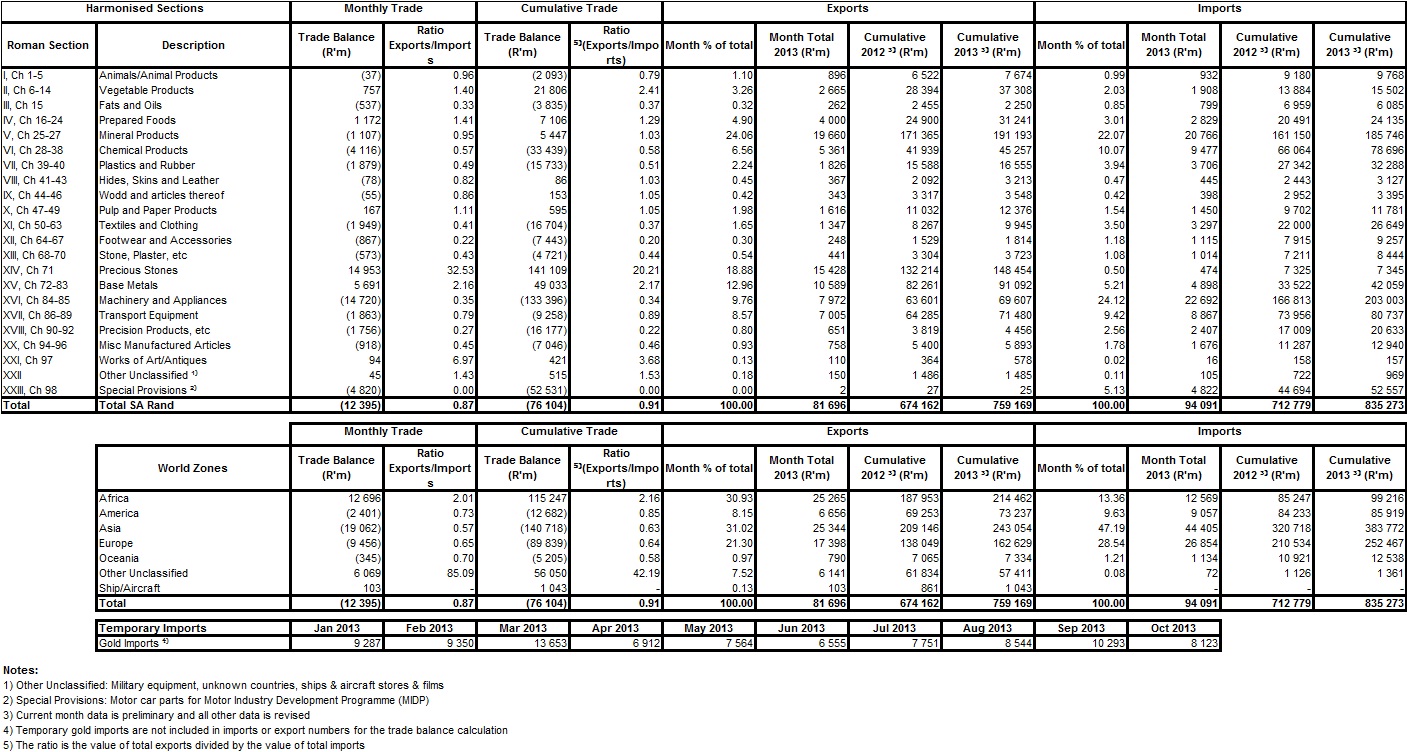
Trade Stats table including BLNS:
Trade Stats table excluding BLNS:
Trade Statistics with BLNS countries
Trade statistics with the BLNS for October 2013 recorded a trade surplus of R8.57 billion.
Summary
The R8.57 billion surplus for October 2013 can be attributed to exports of R11.13 billion and imports of R2.56 billion.
Exports increased from September to October by R1.81 billion (19.4%) and imports increased from September to October by R0.22 billion (9.6%).
The cumulative surplus for 2013 is R70.47 billion compared to R67.54 billion in 2012.
Trade Highlights by Category
- The September to October change (up by 19.4%) in exports of goods reflected increases in:
- Precious and semi-precious stones and metals increased by R 405 million (2638%).
- Machinery and electrical appliances increased by R 268 million (21%).
- Prepared foodstuffs, beverages and tobacco increased by R 201 million (22%).
- Products of the chemicals or allied industries increased by R 190 million (23%).
- Vehicles, aircraft and vessels increased by R 193 million (21%).
- The September to October change (up by 9.6%) in imports of goods reflected an increase and a decrease in:
- Products of the chemicals or allied industries increased by R 315 million (66%);
- Precious and semi-precious stones and metals decreased by R 257 million (-78%).
ENDS.
