Pretoria, 30 August 2013 – The South African Revenue Service (SARS) today releases trade statistics for July 2013 that record a trade deficit of R14.21 billion.
Summary
The R14.21 billion deficit for July 2013 can be attributed to exports of R75.69 billion and imports of R89.89 billion.
Exports increased from June to July by R7.45 billion (10.9%) and imports increased from to June to July by R13.97 billion (18.4%).
The cumulative deficit for 2013 is R89.37 billion compared to R59.02 billion in 2012.
Trade Highlights by Category
- The June to July change (up by 10.9%) in exports of goods reflected increases mainly in:
- Precious and semi-precious stones and metals increased by R3 149 million (22%);
- Base metals and articles thereof increased by R1 265 million (16%);
- Machinery and electrical appliances increased by R1 025 million (18%);
- Vegetable products increased by R 583 million (14%);
- Vehicles, aircraft and vessels increased by R 564 million (8%);
- Products of the chemicals or allied industries increased by R 526 million (15%);
- The June to July change (up by 18.4%) in imports of goods reflected increases mainly in:
- Machinery and electrical appliances increased by R3 799 million (19%);
- Vehicles, aircraft and vessels increased by R2 436 million (32%);
- Products of the chemicals or allied industries increased by R2 290 million (34%);
- Original equipment components increased by R1 174 million (23%);
- Vegetable products increased by R 906 million (78%);
- Plastics and rubber and articles thereof increased by R 761 million (27%);
- Textile and textile articles increased by R 610 million (29%);
- Base metals and articles thereof increased by R 480 million (12%);
- Footwear, headgear, umbrellas and articles increased by R 449 million (67%);
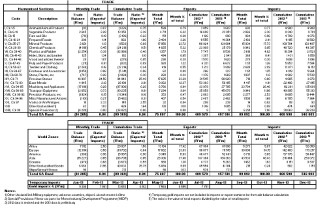
Trade Highlights by World Zone
The world zone results for June to July 2013 as given below are unaudited.
- Asia: The deficit increased from R12 580 million in June 2013 to R15 227 million in July 2013. Exports increased by R5 132 million to R28 306 million and imports increased by R7 778 million to R43 533 million.
- Europe: The deficit increased from R5 635 million in June 2013 to R12 814 million in July 2013. Exports increased by R1195 million to R17 882 million and imports increased by R8 374 million to R30 696 million.
- America: The deficit decreased from R1 166 million in June 2013 to R 368 million in July 2013. Exports increased by R 487 million to R8 345 million and imports decreased by R 311 million to R8 713 million.
- Africa: The surplus increased from R6 835 million in June 2013 to R7 912 million in July 2013. Exports decreased by R1 004 million to R13 184 million and imports decreased by R2 080 million to R5 273 million.
- Oceania: The deficit decreased from R 622 million in June 2013 to R 474 million in July 2013. Exports increased by R 252 million to R 988 million and imports increased by R 104 million to R1 462 million.
For more information, visit the Trade Statistics page.
Trade Statistics table: